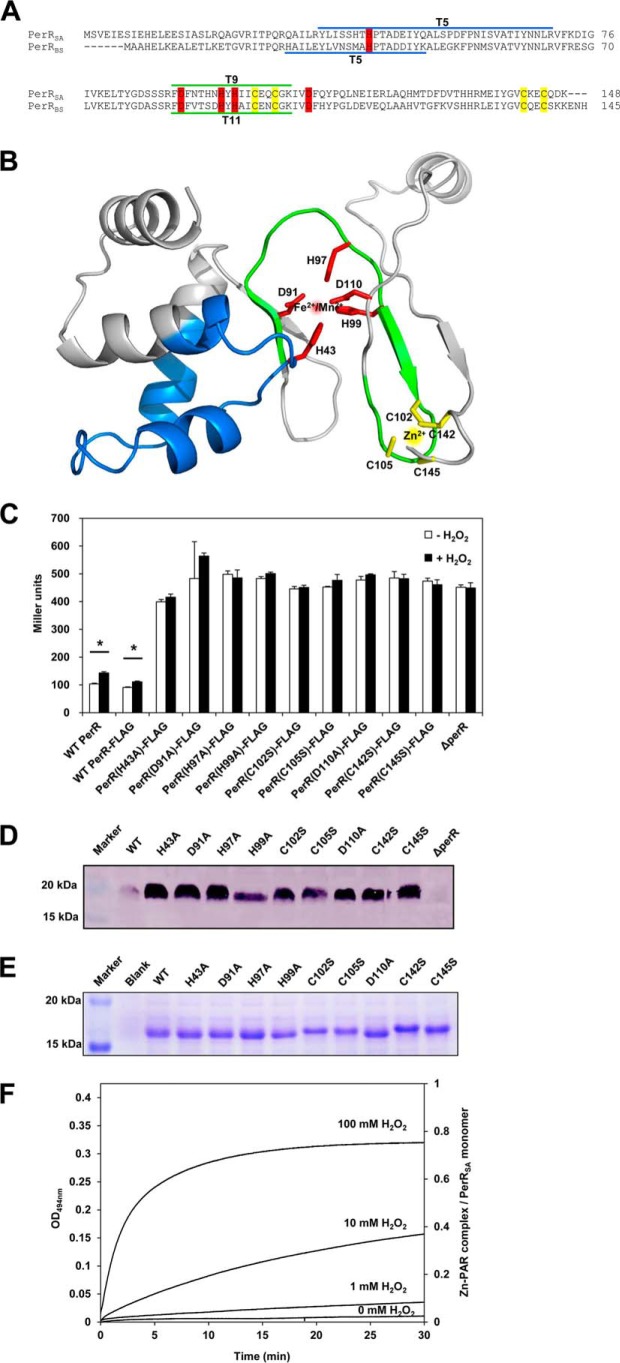
FIGURE 1.
Metal binding sites of PerRSA. A, sequence alignment of PerRSA with PerRBS. The candidate ligands for Zn2+ (yellow) and Fe2+/Mn2+ (red) are conserved in PerRSA. The two tryptic peptides of PerRSA, T5 (blue) containing His-43 and T9 (green) containing His-97, are the sites of oxidation. The tryptic peptides of PerRBS, T5 containing His-37 and T11 containing His-91, are also shown. B, predicted structure of PerRSA monomer based on PerRBS structure (Protein Data Bank code 3F8N) (25) using Swiss Model (40). C, mutational analyses of PerRSA. Wild type S. aureus cells (WT PerR, LS0107), S. aureus cells expressing no PerRSA (ΔperR, LS0245), or S. aureus cells expressing PerRSA-FLAG variants as indicated, were grown in LB medium and treated with 100 μm H2O2 (+H2O2) for 30 min or not (−H2O2). Repressor activities of PerRSA variants were measured using PkatA-lacZ reporter fusion and were expressed as Miller units of β-galactosidase activity (values represent the mean ± S.D. from three separate experiments). Statistical analysis was performed with a Student's t test (*, p < 0.05). D, analysis of expression levels for PerRSA variants. S. aureus cells, expressing no PerRSA (ΔperR) or expressing PerRSA-FLAG variants as indicated, were grown in LB medium. The expression levels of FLAG-tagged PerR variants were analyzed by Western blot using anti-FLAG antibody. E, structural Zn2+-binding assay of PerRSA variants on SDS-PAGE gel. The crude extracts of E. coli cells, overexpressing no PerRSA (Blank) or overexpressing PerRSA variants as indicated, were preincubated with 10 mm DTT and separated by SDS-PAGE using Tris glycine buffer system. Protein bands were detected by Coomassie Brilliant Blue R staining. F, oxidation of Cys4:Zn site by H2O2. Release of Zn2+ from PerRSA:Zn (5 μm purified PerRSA) was measured by monitoring Zn2+-PAR complex at 494 nm after treatment of 0, 1, 10, and 100 mm H2O2 as described previously (15). The Zn2+ content was calculated using a molar extinction coefficient of 85,000 m−1 cm−1 at 494 nm for Zn2+-PAR complex (15).

