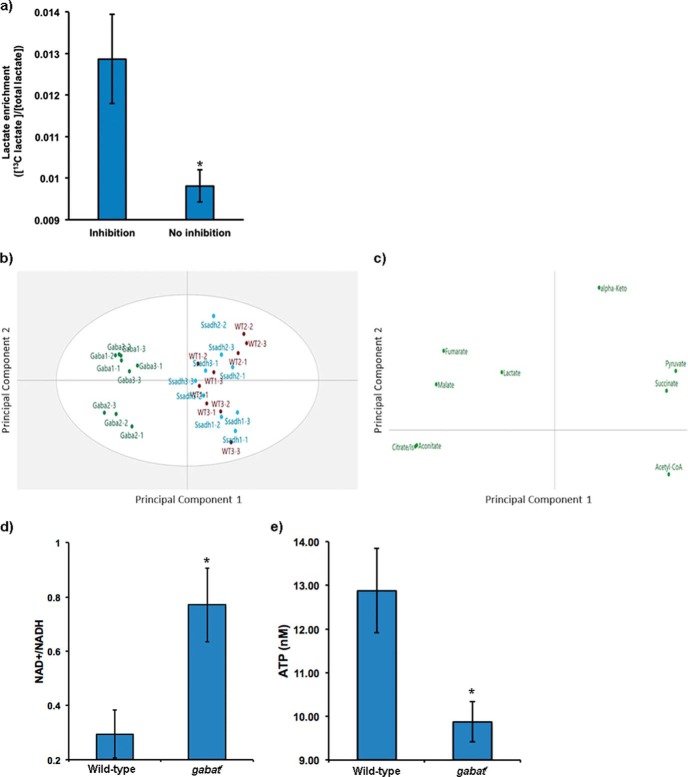
FIGURE 6.
gabat mutants display deficiencies in bioenergetics. a, Drosophila CNS cells were fed 0.5 mm [13C5]glutamate with or without 1 mm of the GABAT inhibitor EOS. Labeling of lactate from glutamate via the TCA cycle was measured in cell extracts using 1H NMR. Fractional enrichment of labeled lactate was calculated from lactate satellite peaks (centered around 1.32 ppm, d peak of lactate CH3) with respect to the total lactate pool (all in micromolar). A two-tailed Student's t test demonstrated a significantly higher fractional enrichment for lactate in the presence of GABAT inhibition (*, p < 0.05), suggesting increased exogenous glutamate uptake and incorporation into the TCA cycle. b, principal components analysis of TCA metabolite profiles on gabatf, ssadhHP, and wild-type fly heads using LC-MS demonstrates divergence in the metabolite profiles of the gabatf flies compared with wild-type and ssadhHP. Each point represents a fly head sample, with labels indicating group (Gaba = gabatf; Ssadh = ssadhHP; WT = wild-type; numbers indicate biological and analytical replicates, respectively). The overlap in WT and SsadhHP suggests TCA metabolites are highly similar, and divergence with gabatf indicates a unique TCA metabotype. c, principal components analysis loadings plot depicting the disruption in the TCA metabolite profile among the biological groups, suggesting energetic imbalance in flies with a mutation in GABAT. From this plot, fumarate, malate, lactate, citrate/isocitrate, and aconitate can be interpreted to be relatively high in gabatf compared with the other biological groups. The difference between gabatf and ssadhHP/WT is explained by 60% of the variance in the data (R2X = 0.599). d, NAD+/NADH ratios; e, ATP concentrations in heads of wild-type and gabatf flies. Independent sample t test (*, p < 0.05).

