FIGURE 3.
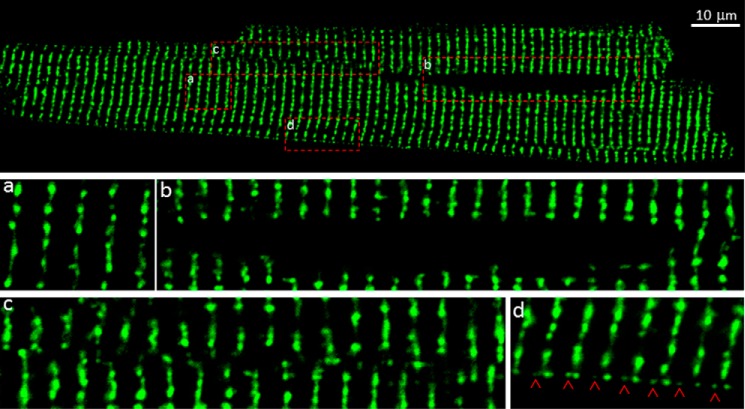
Distribution of GFP-RyR2 clusters in fixed ventricular myocytes. A representative confocal fluorescence image of a fixed ventricular myocyte (n = 84) isolated from GFP-RyR2 mice (top panel) shows the distribution of GFP-RyR2 clusters. Panels a–d show GFP-RyR2 cluster distribution in the cell interior (panel a), the perinuclear region (panel b), regions with disordered clusters (panel c), and the subsarcolemmal region (panel d). Red arrowheads indicate intercalated GFP-RyR2 clusters at the periphery of the cell.

