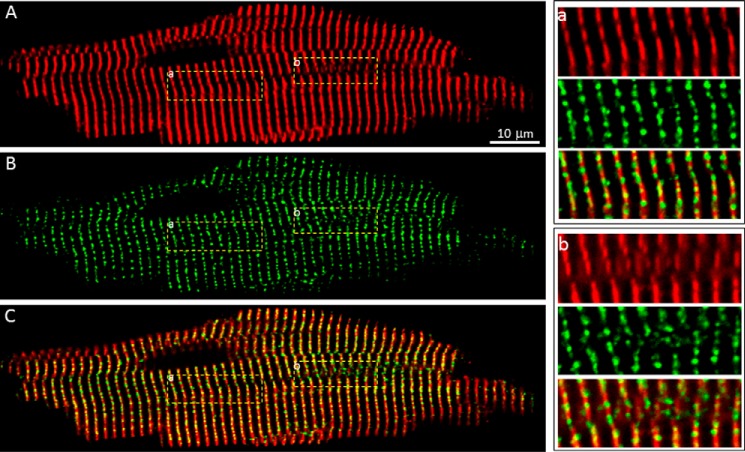
FIGURE 4.
Co-localization of GFP-RyR2 clusters with the z-Line zone. A, a representative confocal fluorescence image of a fixed, permeabilized GFP-RyR2 ventricular myocyte (n = 39) stained with anti-α-actinin antibody. B, GFP-RyR2 cluster fluorescence signals of the same cell. C, merged image of the α-actinin and GFP-RyR2 signals. The panels at the right show ordered (panel a) and disordered (panel b) co-distributions of α-actinin and GFP-RyR2 clusters.

