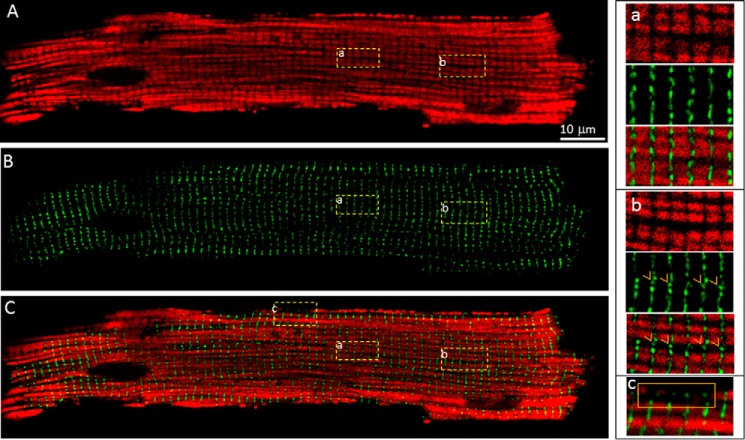
FIGURE 6.
Relative distribution of GFP-RyR2 clusters and mitochondria. A, mitochondria in live GFP-RyR2 ventricular myocytes (n = 24) were labeled with MitoTracker Red-FM and visualized with confocal fluorescence imaging. B, GFP-RyR2 cluster fluorescence signals of the same cell. C, merged image of the MitoTracker Red-FM and GFP-RyR2 signals. The panels at the bottom show GFP-RyR2 clusters located between mitochondria (panel a) or in areas that are devoid of mitochondria in the interior (panel b) or at the periphery (panel c) of the cell.

