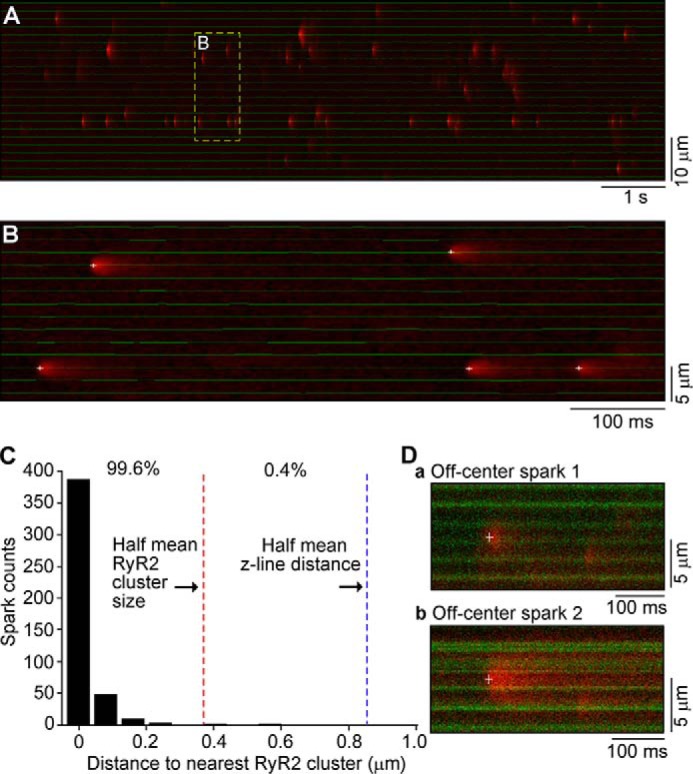
FIGURE 8.

Distribution of Ca2+ sparks in relation to GFP-RyR2 clusters in live ventricular myocytes. A, a representative image of Ca2+ sparks and GFP-RyR2 clusters recorded simultaneously using confocal line scanning as described in the legend to Fig. 7. B, automated detection and localization of Ca2+ spark initiation sites (marked by white crosses) and centers of GFP-RyR2 clusters (indicated by a green line). C, distribution of the distance from spark initiation sites to the center of nearest GFP-RyR2 clusters. D, line scan images of off-center Ca2+ sparks and GFP-RyR2 clusters shown as green bands. Crosses mark the spark initiation sites.
