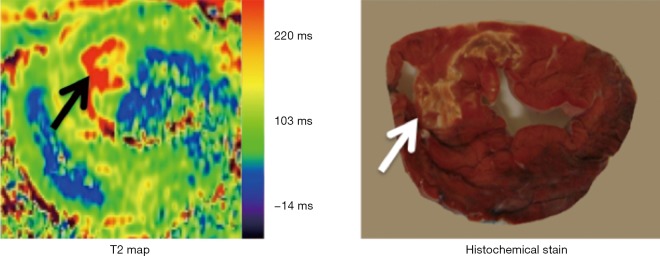
Figure 10.

The image shows the difference in T2 between AMI (arrow) and viable myocardium on T2 map. Note the correspondence between the extents of AMI on MRI and histochemical TTC stain. AMI, acute myocardial infarct; TTC, triphenyltetrazolium chloride.
