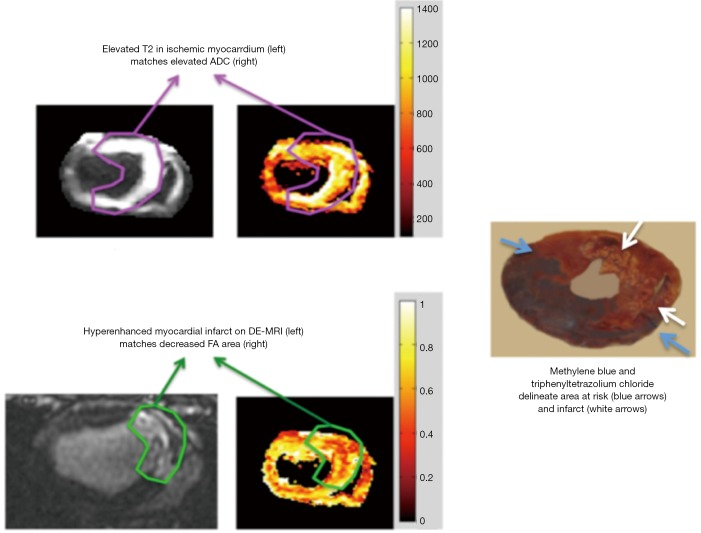
Figure 12.
T2-weighted and ADC maps show the correspondence in delineating myocardial infarct (top block), while the hypointensity area on FA maps corresponds with hyperintensity area on DE-MRI (bottom block), but smaller than the hyperintensity areas on T2-weighted or ADC maps. Histochemical methylene blue and TTC stains delineate the area at risk and infarct, respectively. ADC, apparent diffusion coefficient; FA, fractional anisotropy; DE-MRI, Delayed enhancement MRI; TTC, triphenyltetrazolium chloride.

