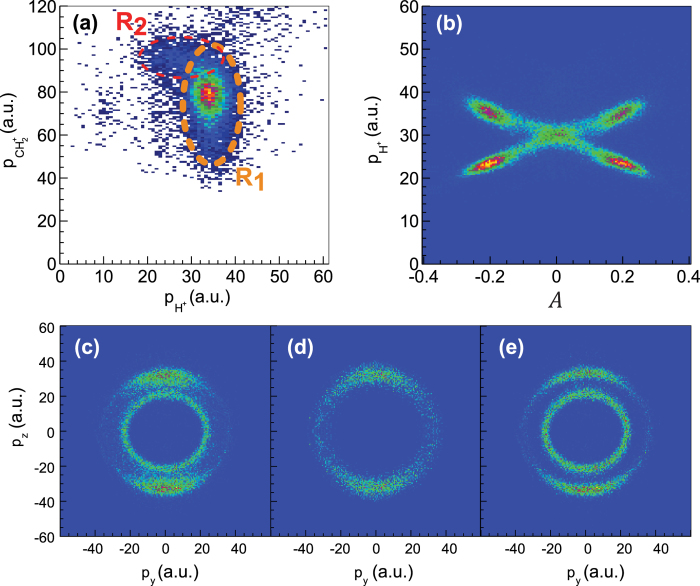
Figure 1.
(a) Momentum correlation map for the final products  . (b) Fragmentation yield over proton momentum and the asymmetry parameter A as defined in the text for the final products
  . (c) Momentum distribution in the laser polarization plane for the reaction shown in (b). (d,e) Proton spectra in the laser polarization plane decomposed from (c) based on the asymmetry parameter A. The proton spectra ejected via the concerted (
 ) and sequential (
 ) fragmentation pathway are shown (d) and (e), respectively. The laser pulse duration and peak intensity are 25 fs and 8 × 10¹⁴W/cm2 for all panels. Here and throughout the paper a.u. denotes atomic units.

