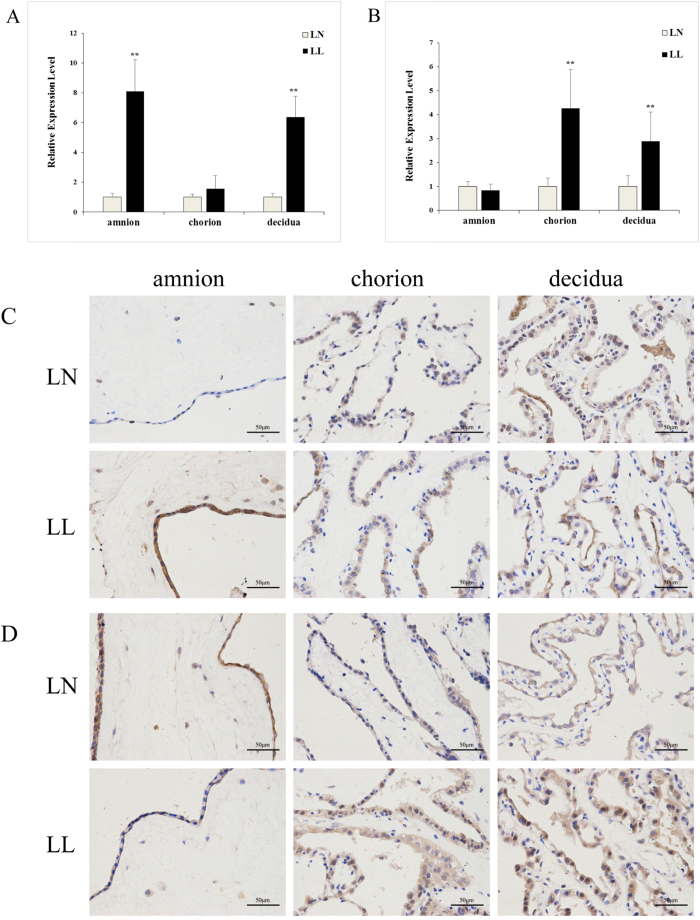
Figure 5. COX-2 and FOS expression in the amnion, chorion and decidua of LL and LN.
(A) COX-2 mRNA level in the amnion, chorion and decidua of LL and LN as determined by qRT-PCR. (B) The expression levels of FOS in the amnion, chorion and decidua of LL and LN were detected by qRT-PCR. (C) COX-2 immunohistochemical results in the amnion, chorion and decidua of LL and LN. Original magnification, 400×. (D) FOS immunohistochemical result in the amnion, chorion and decidua of LL and LN. Original magnification, 400×. All of the error bars indicate SD. *P < 0.05, **P < 0.01.

