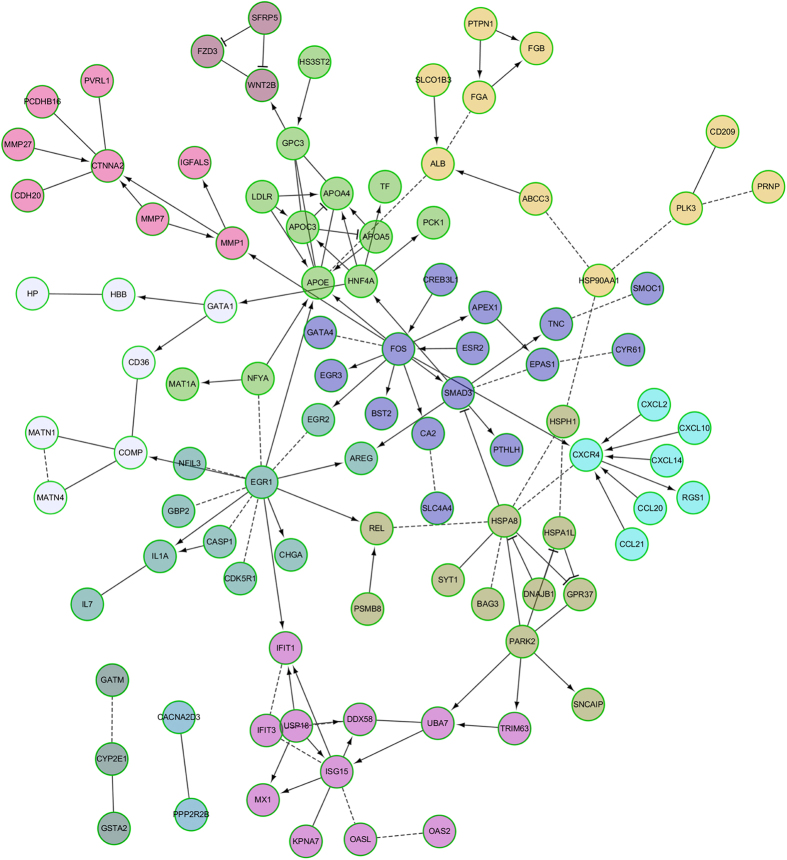
Figure 6. Functional interaction network of DEGs (IFs) in LL compared to those in LN.
The effect of the interaction is represented by arrows, bar-headed lines, straight line and imaginary line. “→” for activating/catalysing, “-|” for inhibition, “-” for FIs that were extracted from complexes or inputs, and “---” for predicted FIs.

