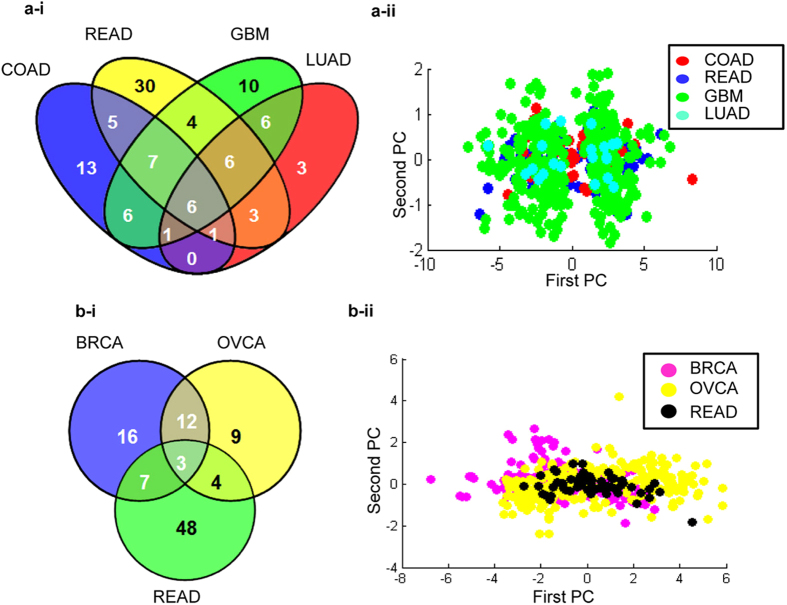
Figure 4.
(a-i) Venn diagram representing common risk genes (p < 0.05); (a-ii) Projection of tumor samples onto the plane defined by the first and the second principal components using 6 risk genes for COAD-READ-GBM-LUAD group, High positive shift along first PC suggests overall decrease in gene expression whereas negative shift denotes overall increase in gene expression; (b-i) Venn diagram and (b-ii) PCA plot for samples of BRCA-OVCA-READ group.

