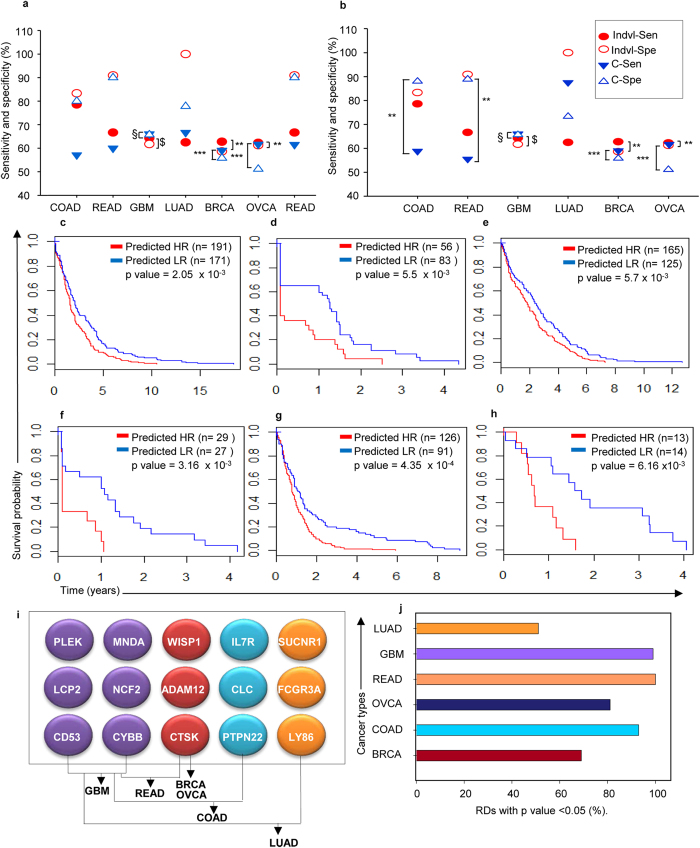
Figure 5.
(a,b) Comparison of prognostic efficacies (Sen-Sensitivity, Spe-Specificity) between (a) individual (indvl) vs. common (c) risk signatures and (b) individual vs. 15-gene signature for six cancers, $-p < 1 × 10⁻⁸, §-p < 1 × 10⁻⁷; (c–h) K-M plots of survival in predicted risk groups based on differential expression of specific gene subsets within the 15-gene signature in BRCA, COAD, OVCA, READ, GBM or LUAD cancers in HR (high risk) and LR (low risk) samples; (i) GBOCRL-IIPr chip for the 15-gene signature (first 6 genes panel (left to right)- 6 common Set 1 risk genes, second 3 genes panel—3 common Set 2 risk genes, third 3 genes panel—3 most significant genes from COAD, last 3 genes panel—3 most significant genes from LUAD); (j) Graphical representation of risk assessment of GBOCRL- IIPr panel through re-sampling in 100 random datasets of the six cancers.

