
Figure 1.
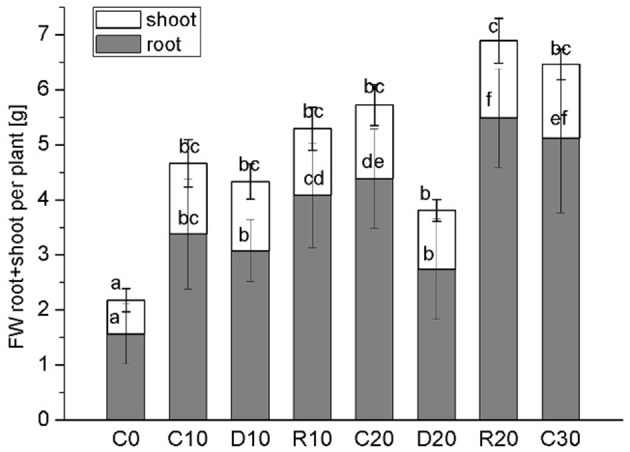
Plant growth parameters. Dark columns‘ part—root FW, white columns’ part—shoot FW. Mean values (n = 12) are given. Vertical bars represent standard deviations. C-control plants, C0, C10, C20, C30—the respective age controls (of days of treatment). D—plants subjected to water limitation treatment for 10 days (D10) or 20 days (D20). R—recovery by resuming optimal water supply for 10 days after 10 days (R10) or 20 days (R20) of water stress. Different letters above columns denote statistically significant differences.