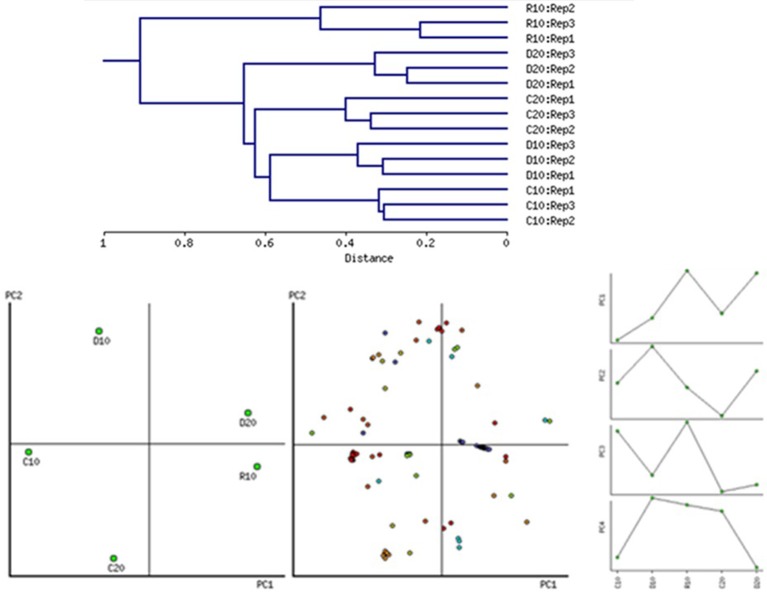
Figure 3.
Sample clustering on the whole dataset of 2-DE spot intensities according to tissue and treatment, principal component analysis biplot (PC1/PC2) and tendencies of changes for the first four PCs. PC1 clearly separates variants depending on age while PC2 –on the treatment. The first four PCs contribute to 83.89% of the variation.

