
Fig. 10.
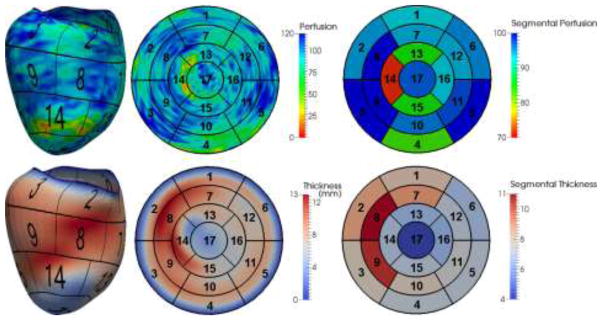
An example of perfusion and thickness quantified using our model. The color maps show the measurement at each point on the mesh, mapped values on the AHA 17-segment model and measurements averaged within each segment.
Official websites use .gov
A
.gov website belongs to an official
government organization in the United States.
Secure .gov websites use HTTPS
A lock (
) or https:// means you've safely
connected to the .gov website. Share sensitive
information only on official, secure websites.
An example of perfusion and thickness quantified using our model. The color maps show the measurement at each point on the mesh, mapped values on the AHA 17-segment model and measurements averaged within each segment.