
Fig. 8.
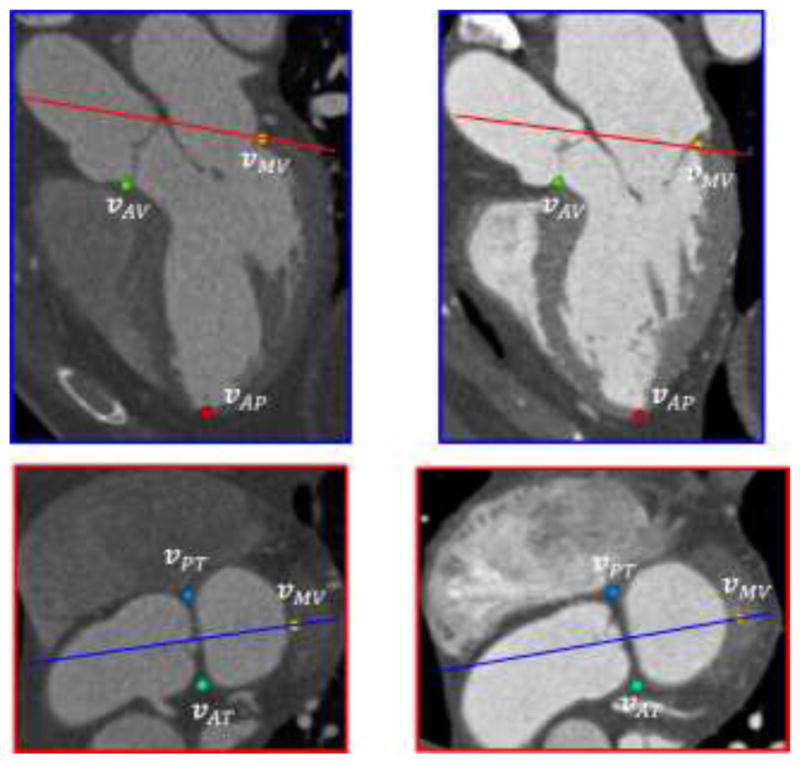
Examples of detected landmarks on two datasets (left and right columns). The colored lines in both planes represent corresponding locations of the other plane.
Official websites use .gov
A
.gov website belongs to an official
government organization in the United States.
Secure .gov websites use HTTPS
A lock (
) or https:// means you've safely
connected to the .gov website. Share sensitive
information only on official, secure websites.
Examples of detected landmarks on two datasets (left and right columns). The colored lines in both planes represent corresponding locations of the other plane.