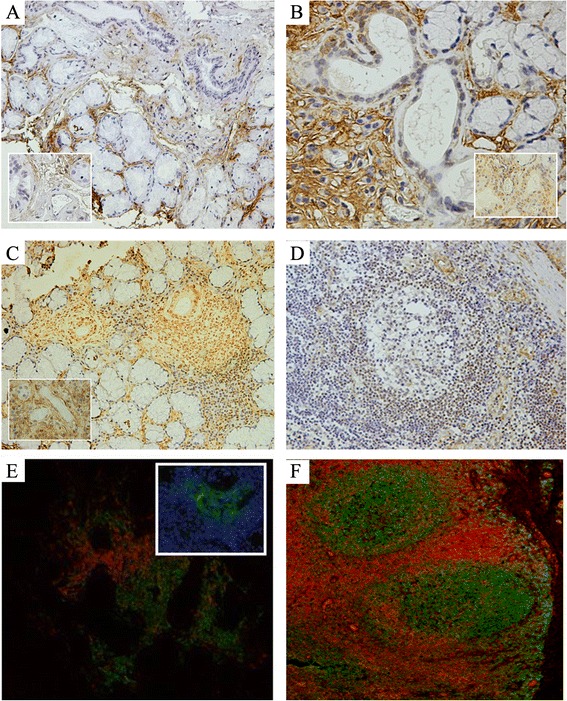
Fig. 2.

Expression of IFI16 in MSG and tonsil. Immunohistochemical analysis for IFI16 in MSG with normal architecture (a), NSCS (b), FLS (c) and in tonsil (d). Inserts in a, b and c depict a detail of endothelial cells from the corresponding panel. e, f Double immunofluorescence staining for CD3 (red) and CD20 (green) in FLS (e) and tonsil (f). Insert in e depicts immunofluorescence staining for CD21 (green) and DAPI (blue), representing a GC-like structure in the CD20+ B-cell area of panel e
