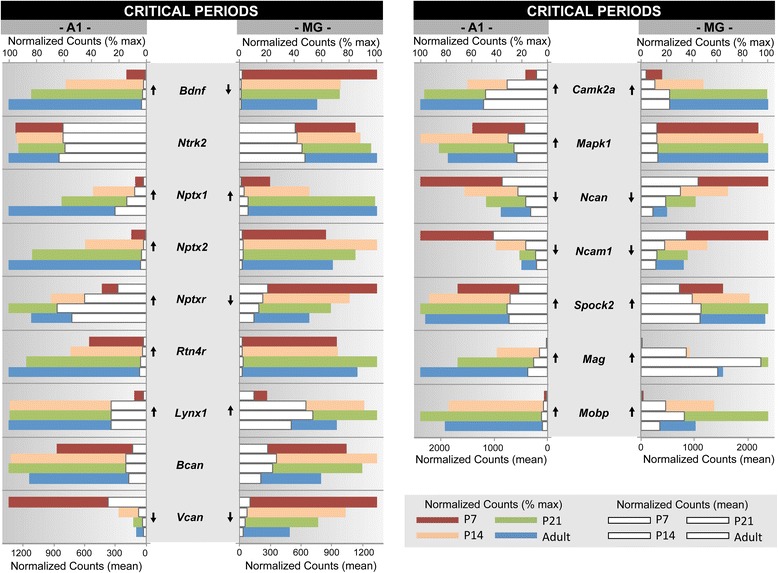
Fig. 8.

Gene expression profiles of a custom gene ontology category. A subset of genes with established roles in critical period formation in the visual cortex [64, 15] is profiled for A1 and MG. The listing spans multiple gene families. For each gene, mean normalized counts and % of maximum counts are plotted by postnatal age (P7, P14, P21, Adult) and brain region (A1, MG). Expression trajectory is indicated by arrows (up, down, none). Arrows were included only when differential expression from P7-Adult was significant (p < 0.05) by all three methods (DEseq2, EdgeR, and Bayseq)
