
Fig. 4.
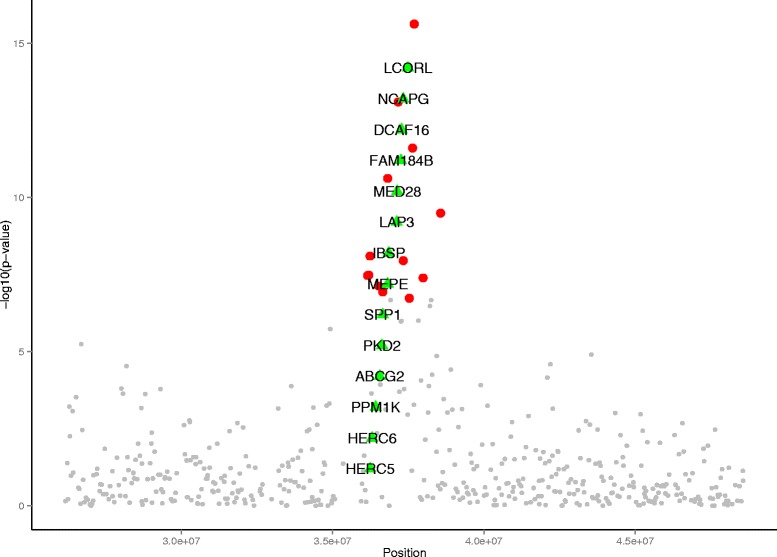
Plot of candidate genes in the QTL region. Plot of the p-values in a 20 Mb region on OAR6 and surrounding candidate genes. Significance (-log10 of P-values) is plotted against positions along the OAR6. A total of 13 significant SNPs are indicated by larger red dots and the candidate genes present in this region are indicated by green triangles. Remaining SNPs are indicated by smaller grey dots