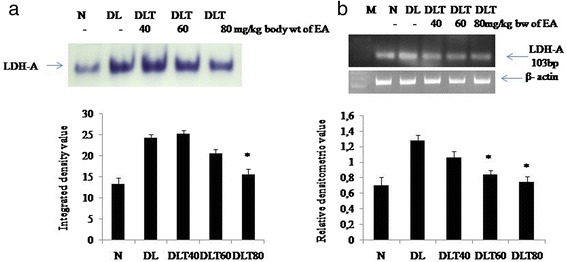
Fig. 7.

Effect of ellagic acid on activity and expression of LDH- A. a In gel assay showing LDH-A activity. b RT-PCR analysis showing mRNA expression of LDH-A. Values are expressed as mean ± SD, * indicates that groups differ significantly from DL at the level of significance p < 0.05 using one way ANOVA followed by Tukey test. N, DL, DLT40, DLT60 and DLT80 represents normal, Dalton’s lymphoma bearing, and Dalton’s lymphoma bearing mice treated with 40, 60, 80 mg/kg body weight of ellagic acid respectively
