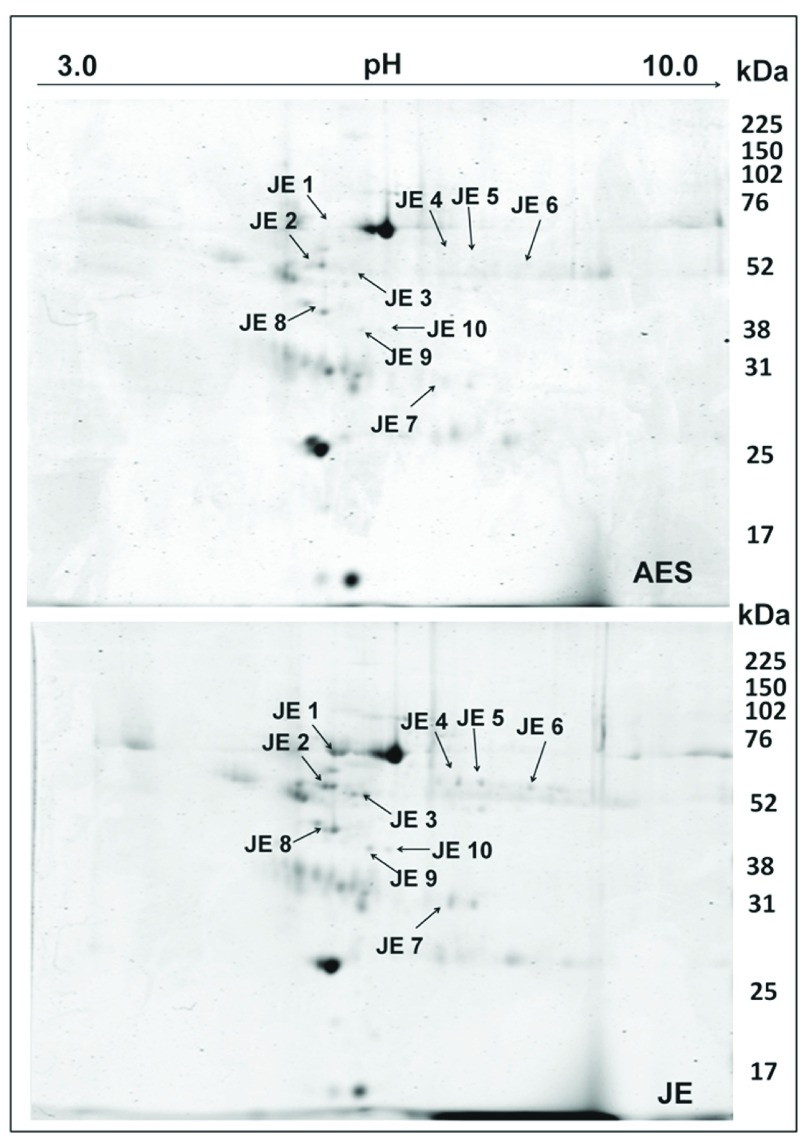
Figure 1. Comparative proteomic analysis of cerebrospinal fluid from AES and JEV patients.
Cerebrospinal fluid samples were pooled and proteins were extracted and separated on immobilized linear pH gradient IPG strips (pH 3.0–10.0) and then in the second dimension on 12% SDS-PAGE. Spots exclusively visualized in the JE- CSF were marked and excised, and identified by MALDITOF/MS and database searches. The spots are labeled on the gel according to the numbers presented in Table 2. Images are representative of 4 replicate experiments.

