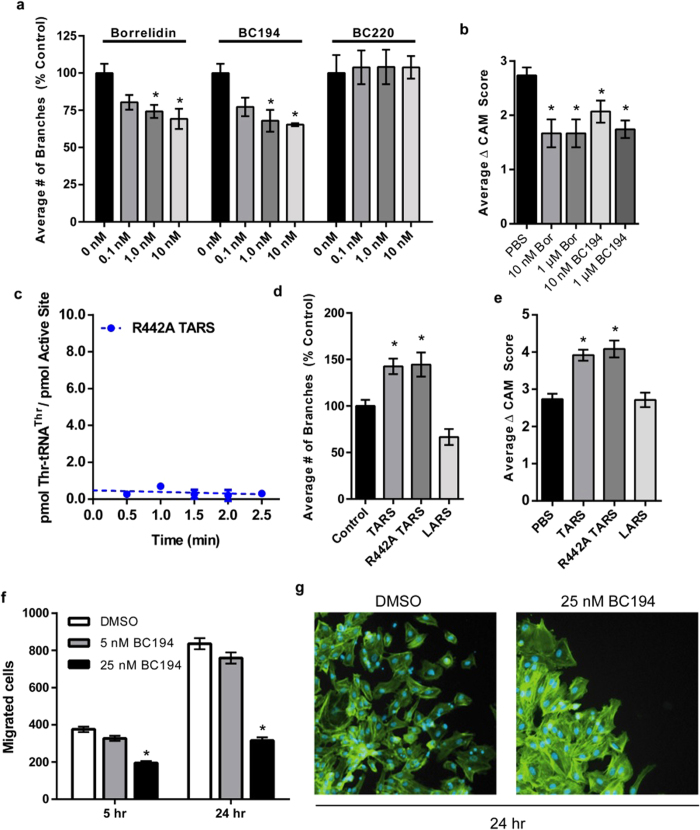
Figure 4. BN and BC194 exhibit comparable inhibition of angiogenesis at sub-toxic levels.
(a) Quantification of HUVEC branching at varying concentrations of BN, BC194, and BC220. HUVECs were plated on Matrigel in full EGM-2 (2% FBS) media and exposed to the indicated concentrations compounds. Cells were fixed after 4–8 h and stained with Oregon Green 488 Phalloidin. Numbers represent percentage of control (0 nM) samples, mean ± SEM, n = 3 *p < 0.05 relative to 0 nM (one-way ANOVA, Tukey Test for each compounds). No significant differences were observed between 0.1, 1, and 10 nM samples within the same treatment or between BN and BC194-treated samples at the same concentrations (t-test for each treatment pair, not indicated in figure). (b) The effects of BN and BC194 on in vivo angiogenesis in a CAM assay. Fertilized chicken embryos were cultured ex-ova for 10 days after which compounds at the indicated concentrations were applied to gelform sponges on the CAM. Images were taken daily over 72 h and quantified as the change in vascularity score over this entire period; mean ± SEM, n ≥ 12, *p < 0.05 relative to PBS (one-way ANOVA, Tukey Test). (c) Aminoacylation activity data for R442A TARS. Numbers represent the formation of Thr-tRNAThr per active site (pmol/pmol) over time; mean ± SEM, n = 3. (d,e) Quantification of HUVEC branching (d) change in CAM vascularity (e) in response to exogenous wildtype TARS, the catalytically R442A TARS, and LARS; mean ± SEM, n = 4, *p < 0.05 (Tube Formation), n ≥ 12, *p < 0.01 (CAM). (f) Quantification of migrated cells exposed to 5 or 25 nM BC194 after 5 and 24 h in the donut assay; mean ± SEM, n ≥ 6, *p < 0.01 relative to DMSO of same time point (one-way ANOVA, Tukey Test). (g) Image of cells at the leading edge of the migratory boundary after 24 h exposure to DMSO (left) or 25 nM BC194 (right). See also Supplementary Figure S4, S5, and S6 for representative images.

