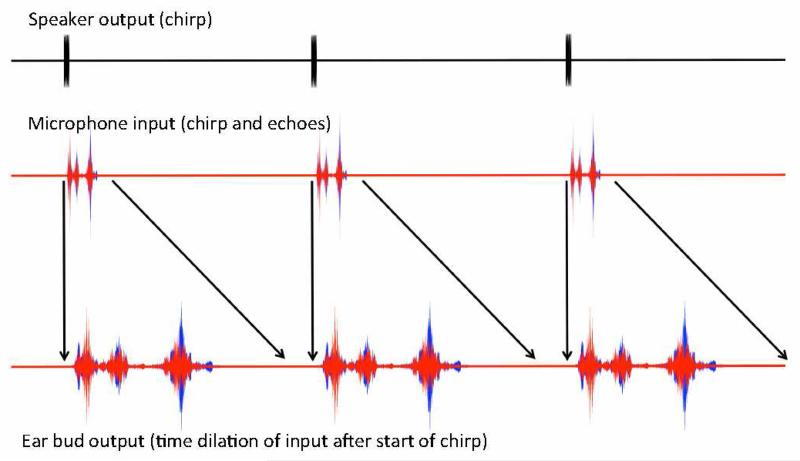
Fig. 2.
Schematic of waveforms at several processing stages, from ultrasonic speaker output to stretched pulse-echo signal headphone output presented to user. Red traces correspond to the left ear signal, and blue traces to right ear signal. Note that the relative temporal scales are chosen for ease of visualization, and do not correspond to the temporal scaling used experimentally.

