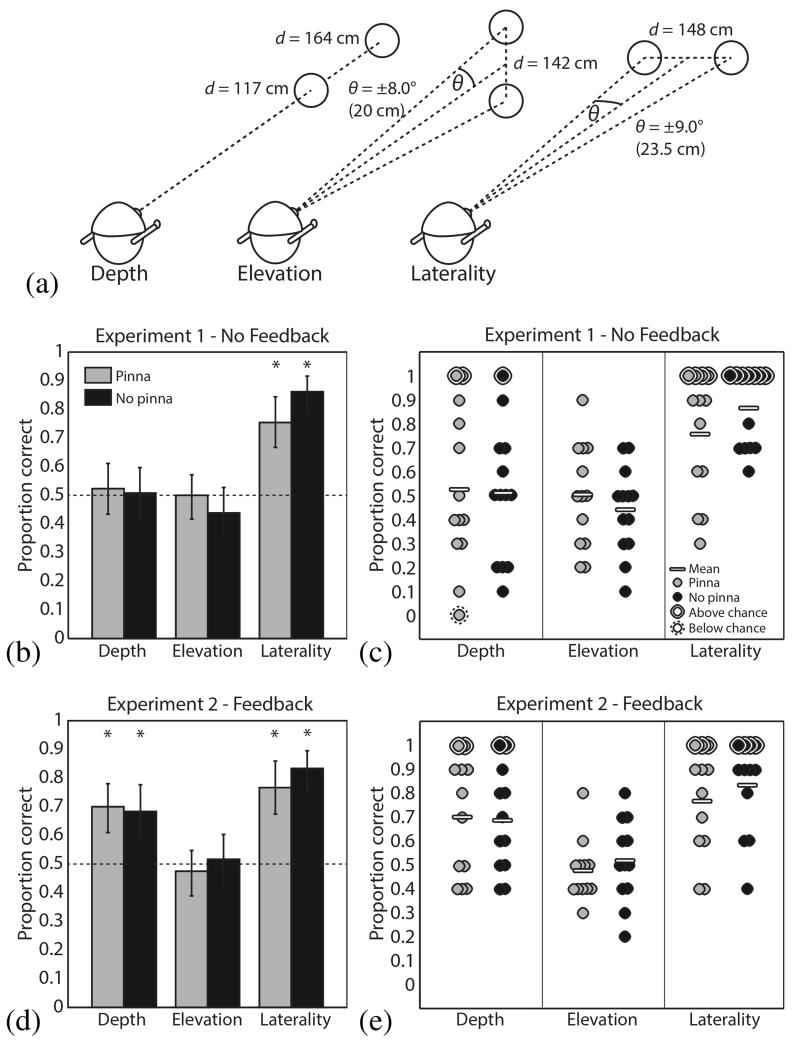
Fig. 4.
Two alternative forced choice spatial localization testing. (a) A diagram of the configurations used to generate stimuli for each of the depth, elevation, and laterality tasks. (b) The fraction of stimuli correctly classified with no feedback provided to subjects (N = 13). Light gray bars indicate results for stimuli recorded with artificial pinnae, while dark gray indicates that pinnae were absent. The dotted line indicates chance performance level. Error bars represent 95% confidence intervals, computed using Matlab’s binofit function. Asterisks indicate significant differences from 50% according to a two-tailed binomial test, with Bonferroni-Holm correction for multiple comparisons. (c) The same data as in (b), but with each circle representing the performance of a single subject, and significance on a two-tailed binomial test determined after Bonferroni-Holm correction over 13 subjects. (d) and (e) The same as in (b) and (c), except that after each trial feedback was provided on whether the correct answer was given (N = 12).

