
FIGURE 3.
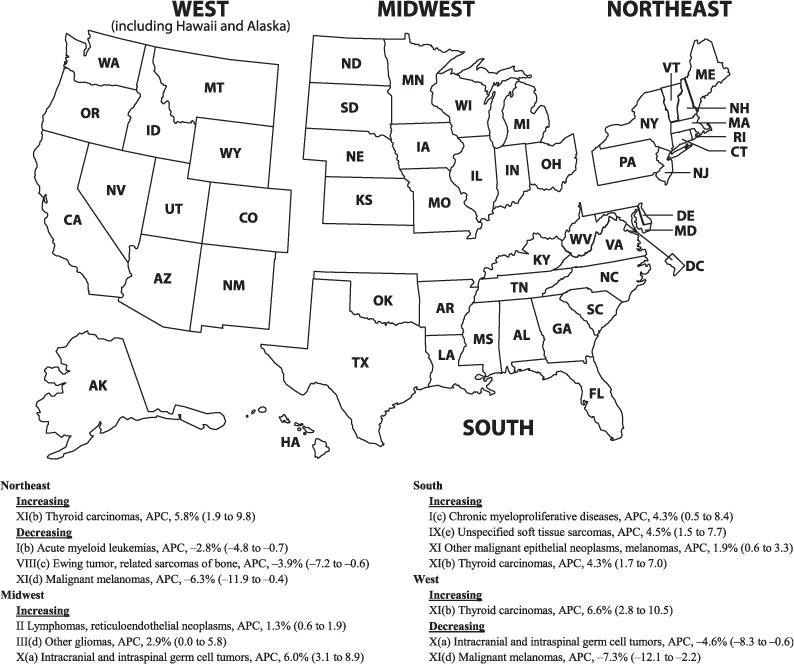
Significant APC of cancer rates in children and adolescents (ages 0–19 years) by ICCC-3 code displayed by US Census region, 2001–2009. Data are from population-based cancer registries that participate in the NPCR or the SEER program. Data include malignant tumors only and cover 94.2% of the US population. APCs were calculated by using weighted least squares method. Statistical significance was determined if the 95% CI of APC did not include zero (P < .05). APCs are expressed with 95% CIs. Some significant values appear to include zero because APC was rounded to the nearest 10th.