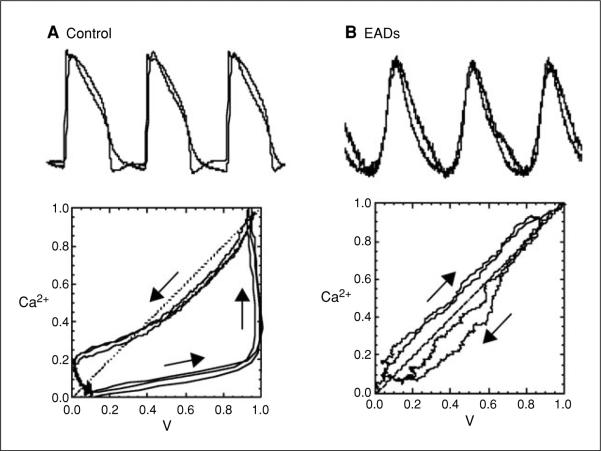
Figure 12.17.15.
Simultaneous Vm and Cai recordings from a Langendorff perfused rabbit heart treated with E4031 (0.5 μM) to induce LQT2. Vm and Cai measured during a normal cardiac beat (A) and during EADs (B) were normalized between 0 and 1 to plot Cai versus Vm and thereby generate phase maps. Phase trajectories were counterclockwise during a normal beat (control A) and clockwise during EADs (EADs B), indicating that during EADs, Cai elevation preceded the voltage depolarization.

