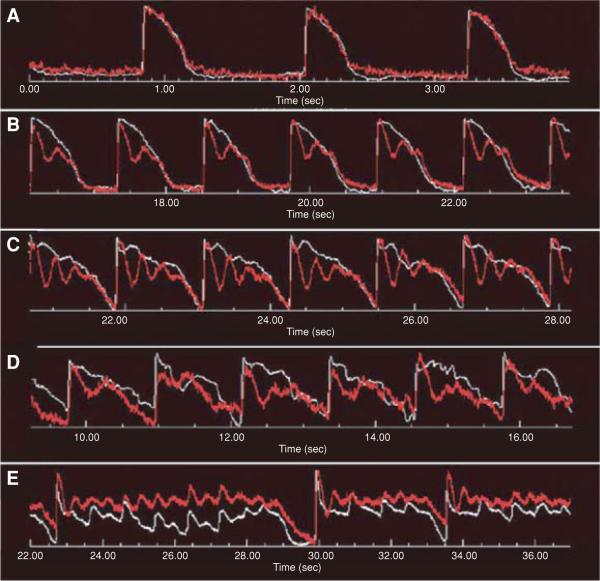
Figure 12.17.16.
Vm (white) and Cai (red) were simultaneously recorded from a rabbit heart before (A) and after perfusion with the IKr blocker dofetilide (0.2 μM) for 2 min (B), 5 min (C), 7 min (D), and 10 min (E). The marked Cai instabilities in B and C clearly precede Vm instabilities and demonstrate a loss of voltage control. For the color version of this figure, go to http://www.currentprotocols.com.

