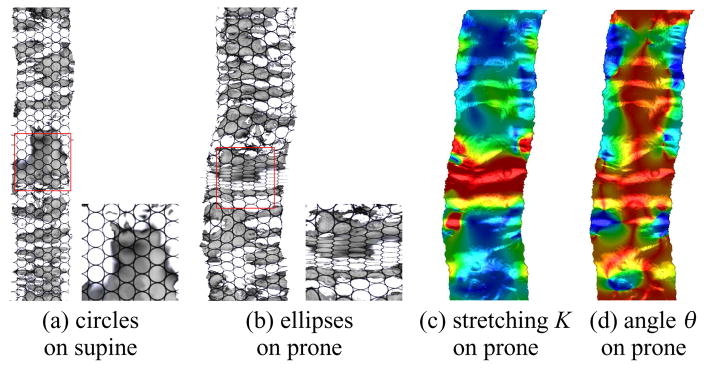
Fig. 14.

Visualization for quasi-conformality: circle fields on the source (supine) are mapped to ellipse field on the target (prone) by the registration map (see the zoomed-in views). The narrower ellipses correspond to the large stretching part (in red).
