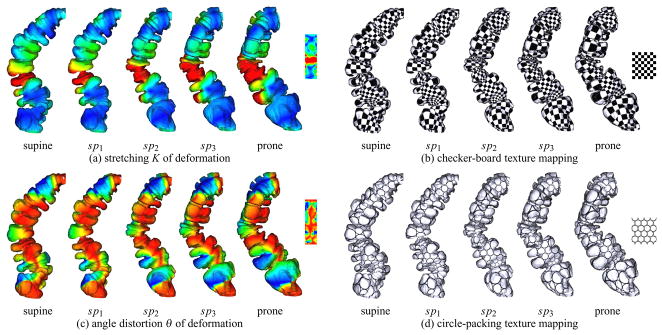
Fig. 15.

Visualization of Beltrami coefficients. The morphing views sp1, sp2, sp3 of geometry between supine and prone are generated by the linear interpolation of the one-to-one registration. The deformation is simulated on the colon segment geometry and four consistent textures are mapped to it to illustrate the corresponding parts of the geometry. In (a) and (c), red indicates the largest stretching/angle distortion and blue indicates the least. The quasi-conformality of the deformation is visualized by the sequences (b) and (d).
