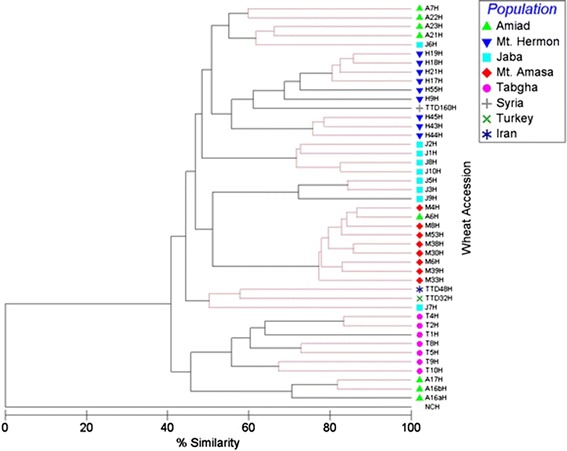
Fig. 3.

Phylogenetic tree generated by multi-dimensional scaling using 290 TMD bands corresponding to Veju-CCGG flanking sites, from accessions of five populations (see top right index). NCH, at the bottom of the phylogenetic tree indicates a negative control (water was used as a template in MSAP reaction). The black lines indicate significant separation, while red lines indicate insignificant separation. The level of epigenetic similarity is indicated on bottom. See Additional file 2: Figure S5 for more details on the statistical analysis
