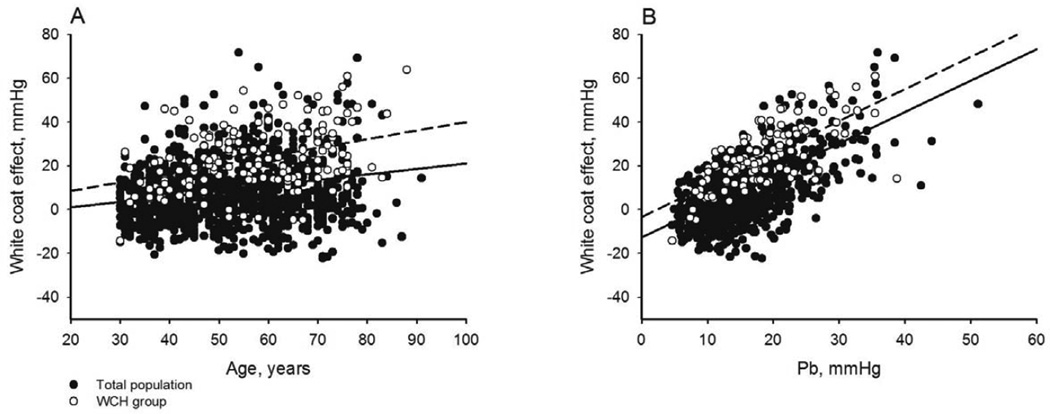
Figure 3.
Regressions of white coat effect on (A) age and (B) amplitude of the backward pressure wave, Pb, in total population (solid dots and solid lines) and subjects with white coat hypertension (WCH, hollow dots and dash lines). Model r2=0.043 and 0.137 for total and WCH cohorts, respectively in Panel A, and 0.411 and 0.504 for total and WCH cohorts, respectively in Panel B, all P<0.001.

