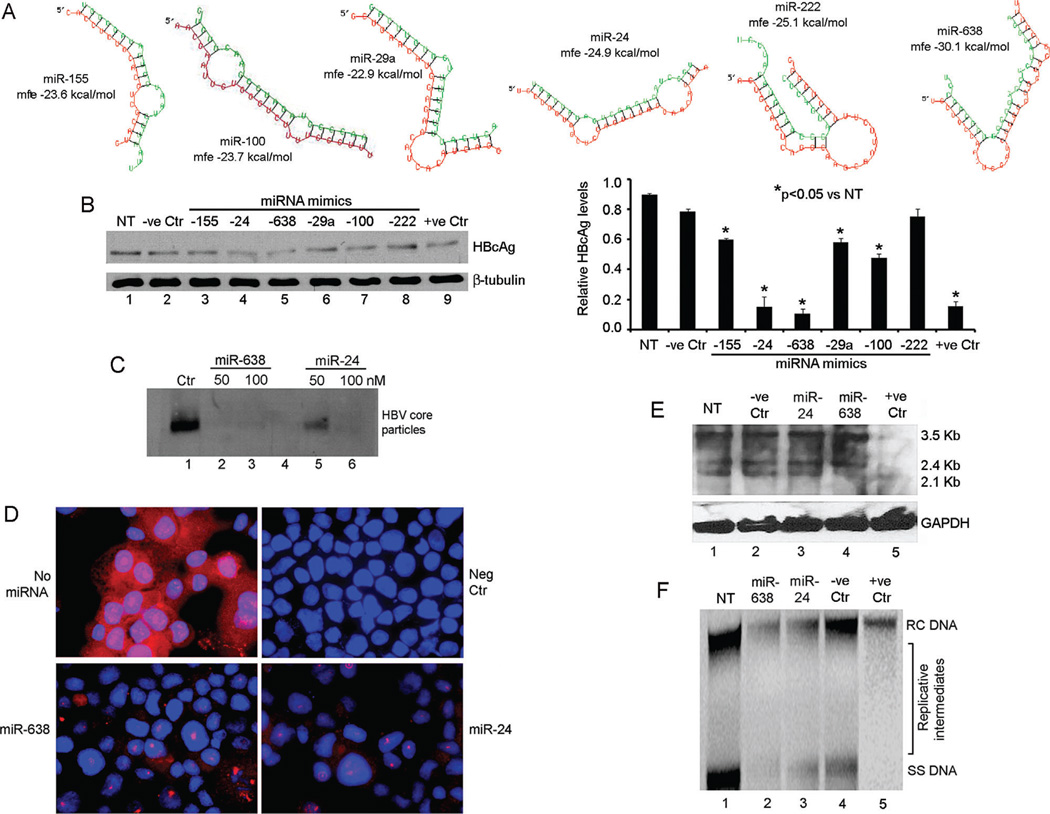
Fig. 5.
Antiviral activity of miRNA in Ad-HBV-transduced HepG2 cells. (A) RNAhybrid alignments of HBV targets for selected miRNA including predicted mfe. (B) HBV core particle agarose gel assay for effects of 100 nM miRNA mimics: lane 1, no treatment control; lane 2, irrelevant miRNA; lanes 3–8, cells treated with mimics indicated; lane 9, cells treated with HBV siRNA. Chart on right provides densitometric data including differences in the antiviral effects of miRNA. (C) HBV core particle agarose gel assay indicated -miR-638 was more potent than -24. (D) HBcAg immunostaining after treatment with 100 nM of -638 and -24 mimics. Control cells without miRNA or without primary antibody (Neg Ctr) were included. (E) Northern blot showing HBV mRNAs after 100 nM miRNA mimics: lane 1, no treatment control; lane 2, irrelevant miRNA; lanes 3–4, cells treated with mimics indicated; lane 5, cells treated with HBV siRNA. (F) Southern blot showing HBV DNA forms, including viral replicative intermediates in cells treated with 100 nM miRNA mimics: lane 1, no treatment control; lanes 2–3, cells treated with mimics indicated; lane 4, irrelevant miRNA; lane 5, cells treated with HBV siRNA. Cells were transduced with 50 moi of AdHBV.

