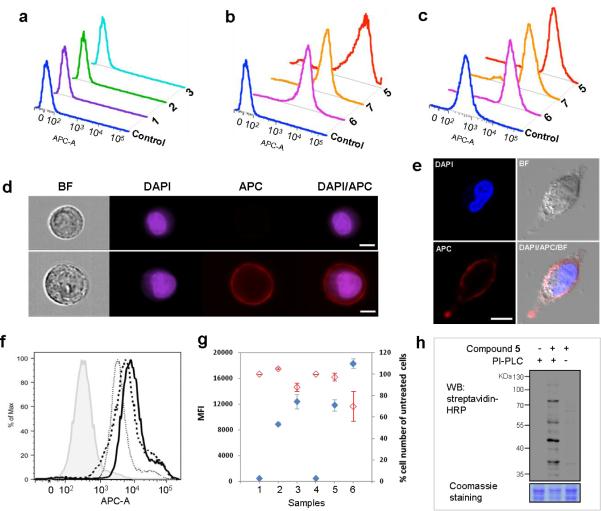
Figure 3.
Detection of GPIs and GPI-anchored proteins on cells treated with or without modified inositol derivatives after click reaction with 4 and staining with streptavidin-APC (for cell analysis) or streptavidin-peroxidase (for protein detection). Flow cytometry results of yeast cells incubated with (a) 1-3 (3 mM) and (b) 5-7 (3 mM); and (c) of A549 cells treated with 5-7 (200 μM). (d) Imaging cytometry results of 5-treated A549 cell suspended in PBS buffer. BF: bright field image; DAPI: the nuclear stain. The upper and lower images are untreated and treated cells, respectively (white scale bar: 7 μm). (e) Confocal microscopy images of 5-treated A549 cell cultured in the dish (white scale bar: 10 μm). (f) Flow cytometry results of A549 cell incubated with 5 (100 μM) in the presence of 0 (solid line), 100 (dashed line), and 200 μM (dotted line) of 8. The filled histogram shows the result of cell not treated with 5 and 8. (g) Influences of the concentration of 5 and incubation time on metabolic engineering of GPIs and GPI-anchored proteins on A549 cell. The concentrations of 5 were 0 (samples 1 & 4, negative controls), 100 (samples 2 & 5), and 200 μM (samples 3 & 6). The cell was incubated for 1 day (samples 1-3) or 2 days (samples 4-6). Blue and red rhombuses show cell labeling and growth, respectively. (h) Western blot of GPI-anchored proteins expressed on 5-treated A549 cell. The supernatants of cells treated with PI-PLC only (left), with 5 and PI-PLC (middle), and with 5 only (right) were subjected to click reaction with 4 and then probed with streptavidin-peroxidase (HRP). Bottom: Coomassie staining to show the protein loading in each lane.

