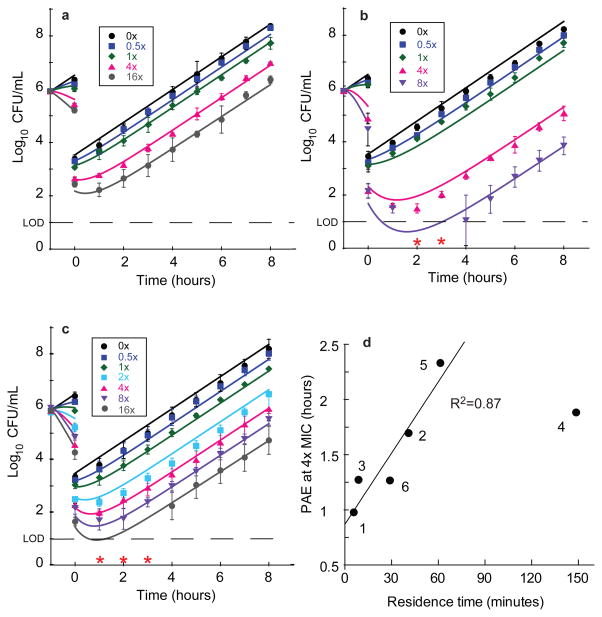
Figure 3. P. aeruginosa PAO1 post antibiotic effect data for representative LpxC inhibitors.
Legends on plots indicate the fold-excess of compound above MIC for the first hour of incubation. Post antibiotic effect data and mechanistic pharmacodynamic model fit for a, Compound 1, b, Compound 4 and c, Compound 6. Data points (symbols) represent mean values from triplicate, independent test occasions. Error bars represent 1 standard deviation of the log10CFU mean. Lines represent model fits to the data using parameters as described in Supplemental Tables 3, 6 and 8. Red asterisks indicate data that were below the limit of detection and omitted from fits (2 and 3 hours 8× MIC panel b and 1–3 hours 16× MIC panel c). d, Correlation of calculated PAE determined at 4×MIC with measured residence time (Table 1). Fitting these data to a linear regression model resulted in a correlation coefficient of 0.87; Compound 4 was excluded from this analysis since the residence time measurements may have been confounded by target rebinding and/or additional slow-binding kinetic effects for this analog (Table 1).

