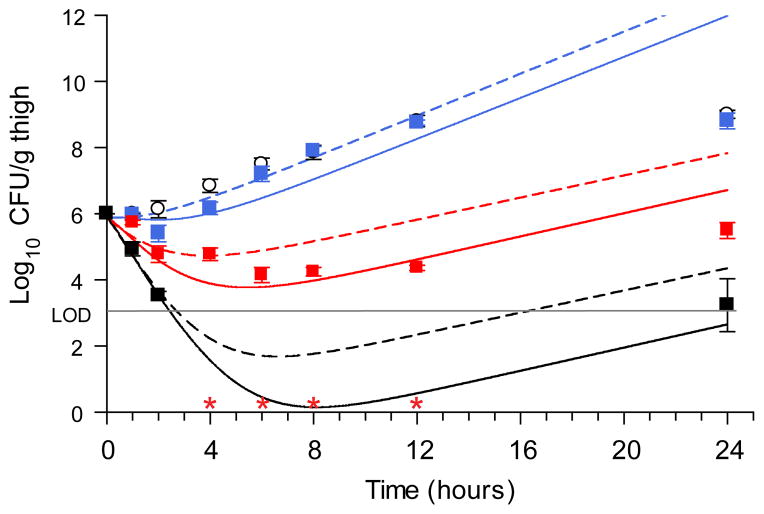
Figure 5. In vivo efficacy curves for Compound 6 with mechanistic pharmacodynamic model fit.
In vivo single dose bacterial P. aeruginosa PAO1 CFU thigh tissue burden after administration of Compound 6 at 10 mg/kg (blue square), 50 mg/kg (red square) and 250 mg/kg (black square). Error bars represent the S.E.M. (n=6 mice/timepoint). Open circles represent the vehicle, untreated control group. Lines represent mechanistic PD model simulations. Solid lines utilized PK parameters from Supplementary Table 11 and biochemical parameters from Supplementary Table 8, but with kgrowth = 0.45 (10 mg/kg dose) or 0.60 (50 and 250mg/kg doses) log10CFU/h and kkill_max = 1.9 log10CFU/h. Dashed lines represent the identical simulation but with k5 and k6 each increased 2000-fold to 120 and 40 min−1 respectively to simulate fast reversible target binding behavior while maintaining the full potency ascribed to the Ki* state.

