
Fig. 3. Hypoxia responses in catalase overexpressing cells.
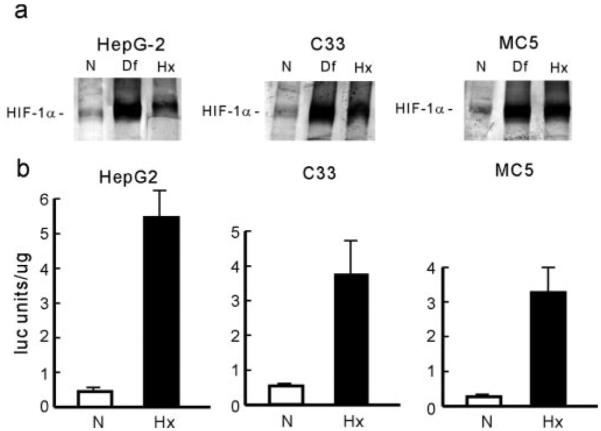
a, expression of HIF-1α. Control HepG2 cells or cells overexpressing catalase in the cytosol (C33) or in the mitochondria (MC5) were exposed to normoxia (N), desferrioxamine (Df), or hypoxia (Hx) for 2–4 h, and nuclear extracts were subjected to Western blot analysis. b, HIF-1α transcriptional activity. Control and catalase overexpressing cells were transfected, as described in Fig. 2, and exposed to normoxia (N) or hypoxia (Hx) for 4 h. Results are expressed as arbitrary luciferase units per µg of protein ± S.D.