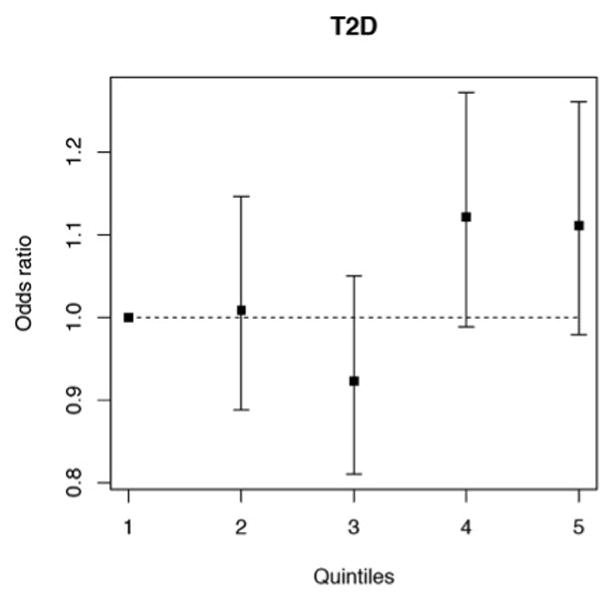
Figure 3.

Association of a weighted genetic risk score with CAD (based on individual-level data of the German MI Family studies I and II and WTCCC CAD consortium). Odds ratios for the association with CAD risk for individuals divided into quintiles (1.–5.) by their individual weight of type 2 diabetes risk alleles, using the 1st quintile as a reference. The Cochran-Armitage trend test indicates a linear increase in risk from bottom to top quintile (p=0.04).
