
Fig. 1.
Projected survival and costs with alternative first-line pediatric antiretroviral therapy regimens.
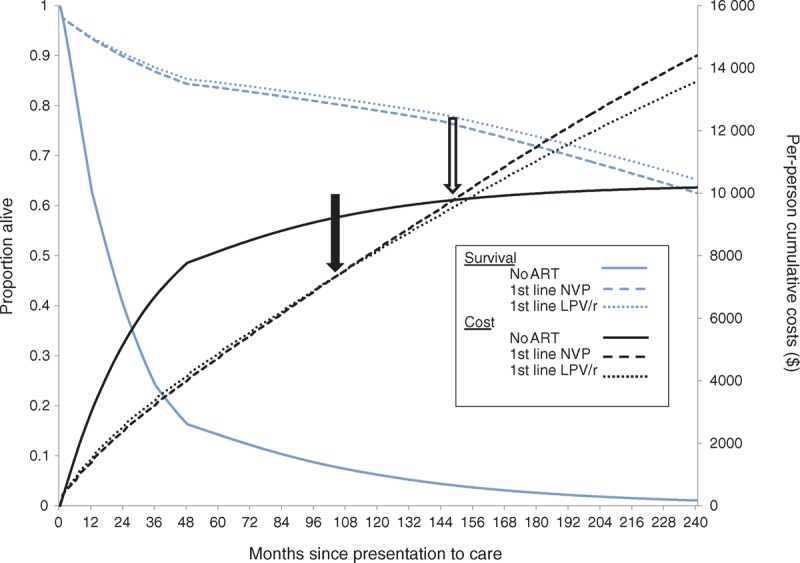
Results are shown for the base case analysis: South African children presenting to care at 12 months of age. The proportion of patients alive is on the left-hand vertical axis (blue lines) and the per-person cumulative costs are on the right-hand vertical axis (black lines). Survival and per-person undiscounted costs are projected over 20 years (240 months) since presentation to care, shown on the horizontal axis. The no ART strategy is represented by solid lines, first-line NVP by dashed lines, and first-line LPV/r by dotted lines. The solid arrow refers to the time after presentation when first-line LPV/r becomes cost-saving compared to first-line NVP: 104 months (8.7 years). Of note, both ART strategies are cost-saving compared to no ART until 149 months (12.4 years) after presentation (open arrow), due to the high costs of care for opportunistic infections and death compared to medication costs. ART, antiretroviral therapy; LPV/r, lopinavir/ritonavir; NVP, nevirapine.