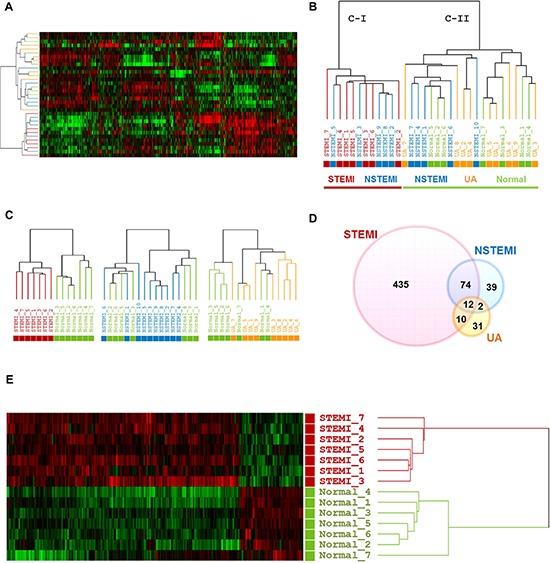
Figure 2. Transcriptome scans of onset of early stage ACS exhibited characteristic molecular signature in patients with STEMI.

A. and B., Unsupervised hierarchical clustering of normal group and three categories of ACS. C., Dendrograms derived from unsupervised clustering analysis of each ACS with normal group using the 8,945, 9,241 and 9,376 gene sets for STEMI, NSTEMI and UA, respectively. D., Venn diagram showing overlap outlier genes between three different categories of ACS groups versus normal group. E., Heatmap of the 531 DEGs between STEMI and normal group is shown. In this heat map, each strip represents a subject and each column represents the collection of genes. The intensity of each pixel is proportional to the relative gene expression levels in 1 sample. Upregulated genes are shown in red, downregulated genes are shown in green. Log ratios between the intensity of each sample and the baseline are shown.
