
Figure 7. Reduction in CtIP protein levels attenuates ATR activation.
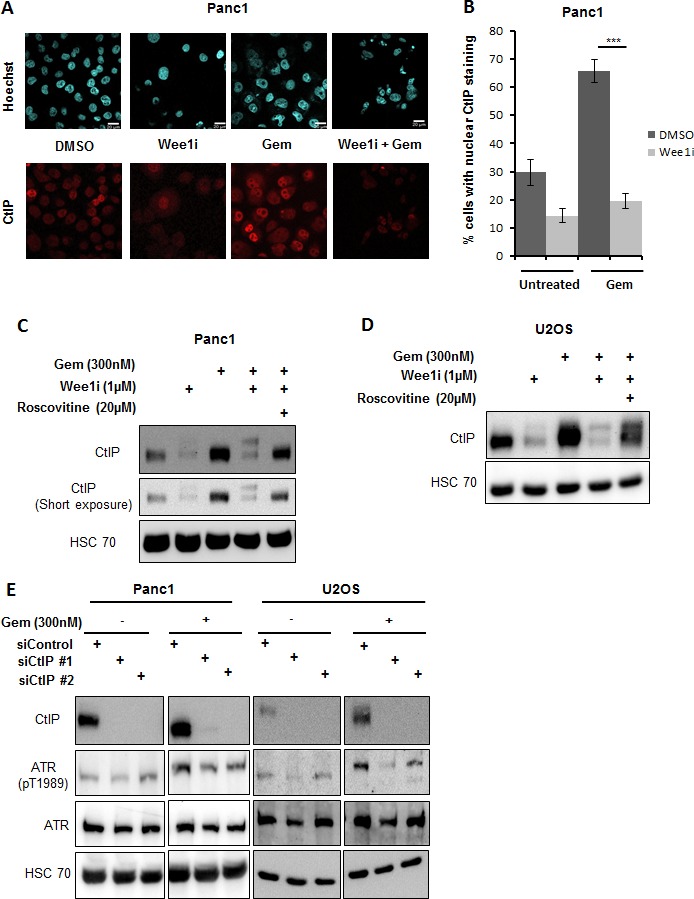
A, B. Panc1 cells were treated with combinations of Wee1 inhibitor and gemcitabine for 24 h. The cells were fixed and stained for CtIP by immunofluorescence. Images were taken using confocal microscopy A. Quantitative analysis was done by evaluating at least 100 cells per sample B. Error bars represent the SD. Scale bar represents 20μm. C, D. Panc1 and U2OS cells were treated with combinations of Wee1 inhibitor, Roscovitine and gemcitabine for 24 h. Blots were stained for CtIP. HSC 70 was stained as a loading control. E. Panc1 and U2OS cells were transfected with two different siRNAs against CtIP and negative control siRNA. After 48 h, cells were treated with 300nM gemcitabine and harvested at 24 h after gemcitabine addition. Immunoblots were stained for ATR phosphorylation. HSC 70 was used as a loading control. In the figure, immunoblots with and without gemcitabine for each cell line belong to the same blot.