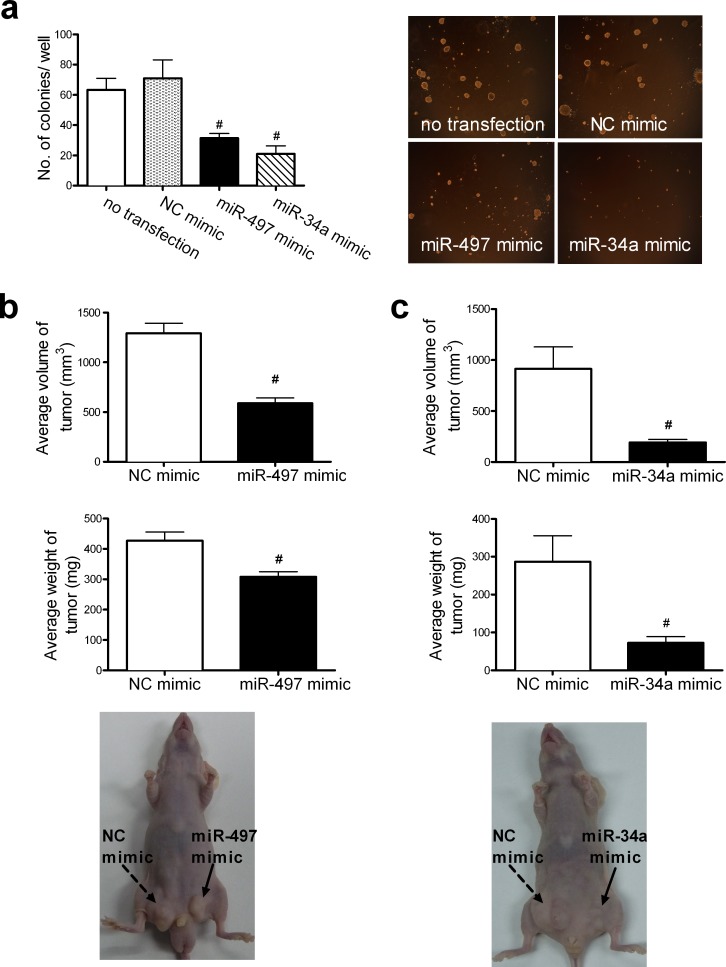
Figure 2. Elevated levels of miR-497 and miR-34a retard cell growth in vitro and in vivo.
(a) Colony formation by A549 cells transfected with the miR-497 mimic or the miR-34a mimic was examined in soft agar. The number of colonies per well (≥50 cells per colony) in triplicate wells is shown in the left column. Mean ± SD (#P < 0.01 vs. NC mimic). A representative result of the colony-formation assay is shown in the right column (original magnification, ×40). The effects of miR-497 (b) or miR-34a (c) on tumor formation were examined in a nude mouse xenograft model. The bilateral inguinoabdominal flanks of nude mice were injected s.c. with NC-mimic-transfected A549 cells (left flank) and miR-497-mimic-transfected A549 cells (right flank), or with NC-mimic transfected A549 cells (left flank) and miR-34a-mimic-transfected A549 cells (right flank). The miR-497-mimic-transfected or miR-34a-mimic-transfected cells generated tumors with smaller volumes and lower weights, as determined at necropsy, than those of tumors generated with NC-mimic-transfected cells in the contralateral flanks. Mean ± SD, n = 7 (#P < 0.01, all vs. NC mimic). Photographs illustrating the features of tumor growth at necropsy are shown at the bottom of Fig. 2b and 3c.

