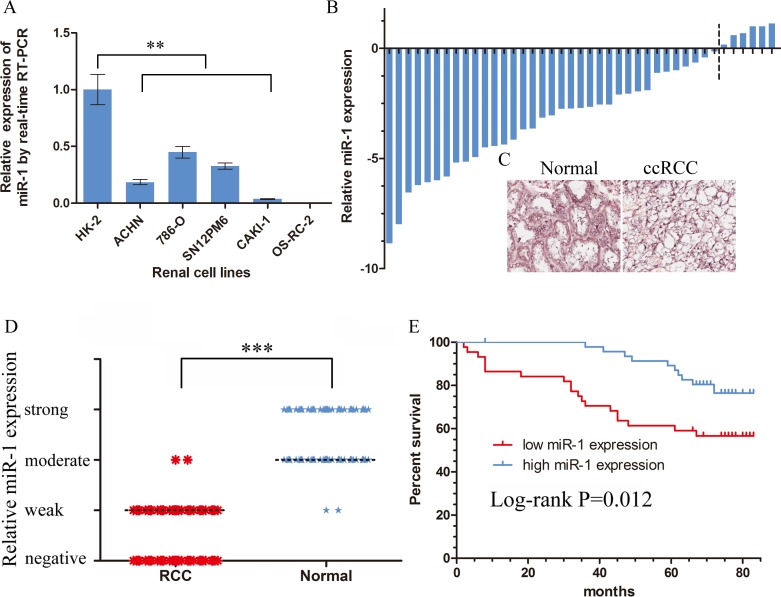
Figure 1. Downregulation of miR-1 in ccRCC correlated with poor patient survival.
Real-time PCR analysis of miR-1 expression in immortalized human renal tubule epithelial cell line HK-2 and indicated renal carcinoma cell lines. Data were plotted as the mean ± SEM of three independent experiments relative to HK-2 cells. **, P < 0.01. B. Relative expression of miR-1 in 41 pairs of ccRCC tumor tissues and their corresponding adjacent non-cancerous tissues (Δtumor-Δnormal). The average miR-1 expression was normalized by U6 expression. C. Expression of miR-1 in tumor tissues and their corresponding adjacent non-cancerous tissues by in situ hybridization (ISH). D. The expression level of miR-1 was measured by H-score. Negative (−, score: 0), weak (+, score: 1–4), moderate (++, score: 5–8) and strong (+++, score: 9–12). ***, P < 0.001. E. Kaplan-Meier analysis of correlation between the miR-1 level and overall survival of ccRCC patients with high (n = 47) and low (n = 43) miR-1 expression. In the Kaplan-Meier analysis, negative was recognized as low expression, weak and moderate were recognized as high expression.

