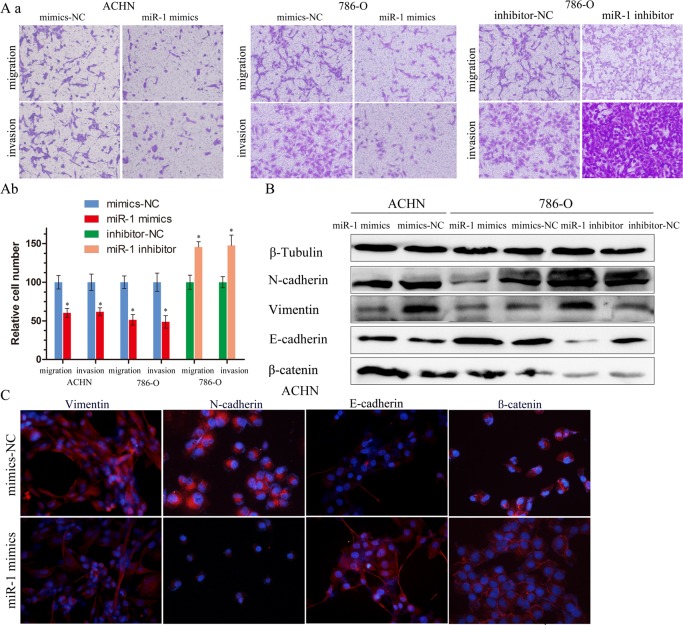
Figure 3. miR-1 attenuates ccRC cell migration and invasion.
A. a. Migration and invasion assay for renal cancer cells. Representative photographs were taken at ×200 magnification; number of migrated cells was quantified in ten random images from each treatment group. b. Results were the mean ± SEM from two independent experiments and plotted as percent (%) migrating cells relative to mimic-NC or inhibitor-NC. *P < 0.05. B. EMT-related proteins were determined by immunoblot analysis. β-Tubulin was used as loading control. C. Representative photographs of immunofluorescence were taken at ×200 magnification. ACHN cells were transfected with 100 nM of indicated small RNA molecules.

