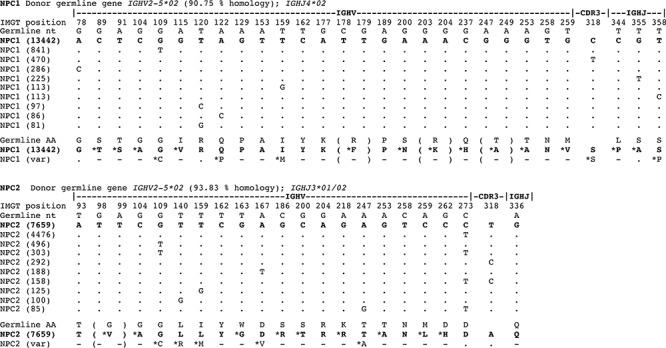
Figure 3. Oligoclonal expansions identified in IGHV gene sequences derived from normal plasma cells in the bone marrow reveal marked intraclonal variation.

IgG transcript profiles obtained by deep sequencing were aligned with germline IGHV genes and CDR3 identity used to identify oligoclonal expansions in normal human plasma cells. Only informative selected codons are shown, not entire IGHV genes. The largest oligoclonal expansion in each of NPC1 and NPC2 samples are shown, indicating % homology to donor germline gene, and the top 10 clonally-related transcripts are aligned at the nucleotide level to show sequence identity to the top read (by dots) or replacement nucleotides as shown in sequences. The data reveals a significant level of intraclonal variation in oligoclonal expansions of normal plasma cells in IGHV gene sequence mutations. Translation to deduced amino acid (aa) are also shown comparing germline with plasma cell IGHV gene sequence. For both NPC1 and NPC2 aligned sequence matches start at position 65.
