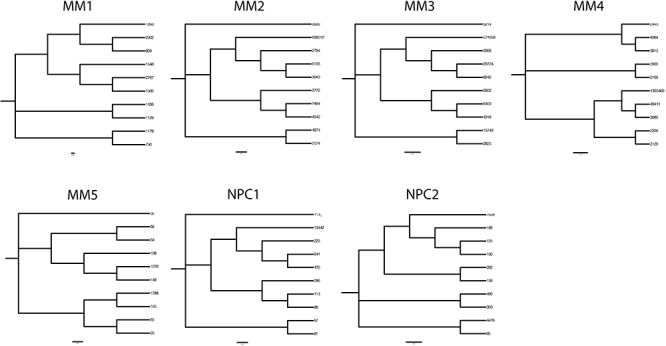
Figure 4. Phylogenetic trees delineating hierarchical derivation of clonally related IGHV gene sequences in MM and in normal plasma cells in the bone marrow.

Phylogenetic analysis of the 10 most prevalent clonal expansions linked by identical CDR3 motifs in MM and normal plasma cells were aligned using Clustal Omega and nearest neighbor joining trees plotted. Node numbers indicate read count for each sequence variant.
