
Figure 2. Relative risks (RRs) and the corresponding 95% confidence intervals (CIs) for the dose-response relationship between alcohol drinking (grams per day) and renal cell carcinoma (RCC) risk among the overall population.
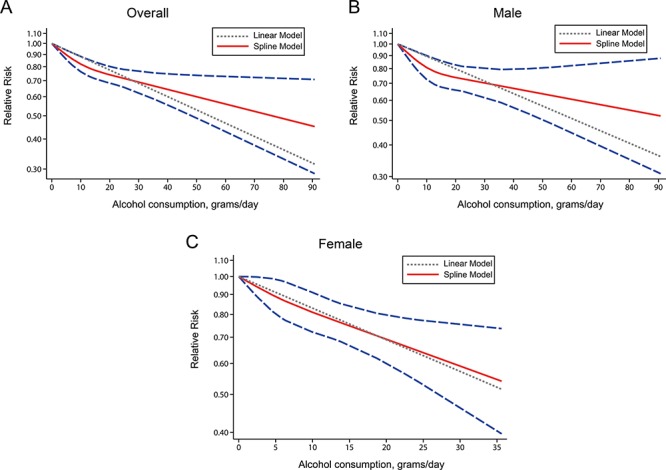
A. males B. and females C. The solid line and the long dash line represent the estimated RRs and their 95% CIs. Short dash line represents the linear relationship.