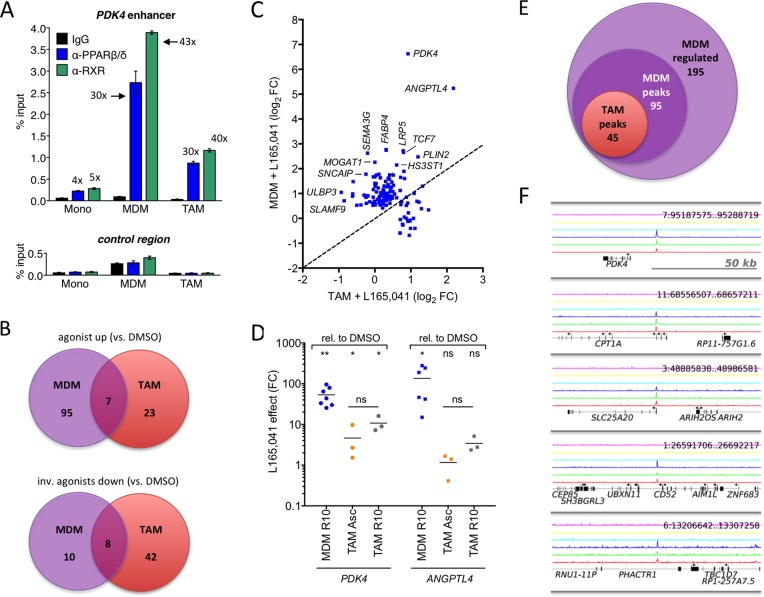
Figure 2. Deregulation of PPARβ/δ target genes in cultured ovarian carcinoma TAMs.
A. PPARβ/δ and RXR enrichment at the PDK4 enhancer and an irrelevant control region in human monocytes, MDMs and TAMs (ChIP-qPCR; sample size: 4). B. Venn diagrams of RNA-Seq data showing overlaps of ligand-regulated high-confidence direct target genes in MDMs grown in R10 medium or purified TAMs cultured in ascites for 1 day in the presence of agonist (L165,041), inverse agonist (ST247or PT-S264) or solvent (DMSO). C. Ligand response of PPARβ/δ target genes in TAMs versus MDMs. Data represents the log2 fold change (L165,041 relative to DMS0) calculated from RNA-Seq data. The diagonal line indicates equal regulation in both cell types. D. Expression and ligand response of PDK4 and ANGPTL4 by L165,041 in MDMs in R10 (n = 7) and TAMs (n = 3) cultured in either ascites or R10 medium. Cells were cultured in the presence of ligand or DMSO for 24 h and analyzed by RT-qPCR. Data are expressed as fold regulation (FC) relative to DMSO-treated cells. E. Overlap of genes regulated in MDMs (agonist versus inverse agonist), genomic regions with PPARβ/δ binding sites in MDMs and PPARβ/δ enrichment sites in TAMs (ChIP-Seq). F. PPARβ/δ enrichment (ChIP-Seq) at the PDK4, CPT1A, SLC25A20, CD52 and PHACTR1 loci for 3 different TAM samples (bottom 3 lines: dark blue, green, red). The top 3 lanes (magenta, yellow, light blue) represent the corresponding control IgG runs.

