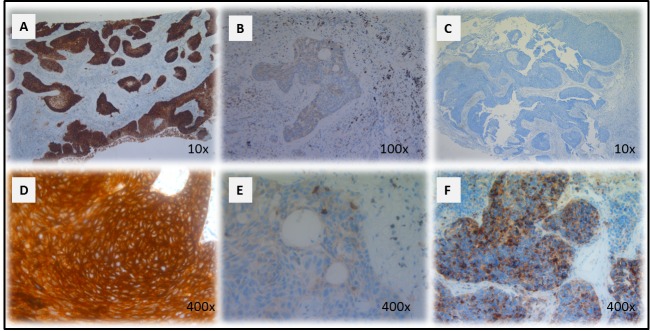
Figure 1. CD70 staining in primary NSCLC.

Representative sections of a NSCLC tumour classified as strong A. and weak B. for CD70 expression based on dye intensity. A CD70 negative NSCLC sample is shown in C. Membranous D. and cytoplasmic E. accentuation of CD70 expression in NSCLC specimens. CD70 expression in a neuro-endocrine NSCLC primary biopsy (F). Magnitude is depicted in the lower right corner.
