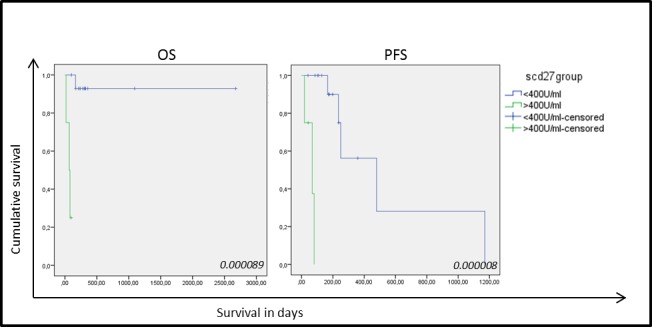
Figure 4. Kaplan-Meier curves for overall survival and progression-free survival based on sCD27 levels in 19 NSCLC samples.

Correlation of sCD27 levels with overall survival (OS) (left) and progression free survival (PFS) (right) in patients with high (green) and low (blue) sCD27 levels. P-values are giving in the right corner.
